Visualizing Glycolysis with Cytoscape.js
This is the second in a series of tutorials by Joseph Stahl about Cytoscape.js. The first post covers creating a 2-node graph with Cytoscape.js and is recommended reading for those unfamiliar with the software.
Getting ready
A container for the graph: index.html
As before, Cytoscape.js requires an area to draw the graph. A simple index.html will get us started.
CSS will again be inline with the HTML to keep things simple.
A full-window graph is used to provide the glycolysis graph with as much space as possible for molecule structures.
<!doctype html>
<html>
<head>
    <title>Tutorial 2: Glycolysis</title>
    <script src='cytoscape.js'></script>
</head>

<style>
    #cy {
        width: 100%;
        height: 100%;
        position: absolute;
        top: 0px;
        left: 0px;
    }
</style>

<body>
    <div id="cy"></div>
</body>
</html>
A list of elements: gly_elements.js
In the interest of keeping different parts of code separate, the steps of glycolysis will be specified in gly_elements.js while the graph-related code will be in glycolysis.js.
Modify the <head> section of index.html to include these two files:
<head>
    <title>Tutorial 2: Glycolysis</title>
    <script src='cytoscape.js'></script>
    <script src='gly_elements.js'></script>
    <script src='glycolysis.js'></script>
</head>
gly_elements.js is a list of the molecules involved in glycolysis.
Because the file is lengthy and repetitive, I will only be including an excerpt in the tutorial.
Each intermediate metabolite will be a node of the graph.
The enzymes that convert each metabolite to the next intermediate will be the edges connecting nodes.
Nodes have four data properties:
id: a unique ID given to the node; in this case, IDs are incrementing integers—good for representing an incremental process such as metabolism. Metabolite names are not used here (despite being unique) because they complicate comparison; there’s no good way to tell that G6P is “greater than” (comes after) glucose without relying on analyzing edges.molecule: the name of the metaboliteimage: a line-drawing image of the metabolite; displaying these images will be covered laterurl: a link to Wikipedia for more information about the molecule
Edges have four data properties:
id: again, IDs are unique incrementing strings, with the exception ofstep5-reversewhich is named such to preserve the ordering found on the Glycolysis Wikipedia articleenzyme: the name of the enzyme involved in each reaction. This will be used to display names on edgessource: in chemistry terms, the reactanttarget: in chemistry terms, the product. Edges go fromsourcetotargetmuch as chemical reactions proceed from reactants to products
// based on https://en.wikipedia.org/wiki/Glycolysis

var GlyElements = {
  nodes: [
    { data: { id: 0, molecule: 'Glucose', image: 'assets/glucose.svg', url: 'https://en.wikipedia.org/wiki/Glucose'} },
    { data: { id: 1, molecule: 'G6P', image: 'assets/g6p.svg', url: 'https://en.wikipedia.org/wiki/Glucose_6-phosphate' } },
    { data: { id: 2, molecule: 'F6P', image: 'assets/f6p.svg', url: 'https://en.wikipedia.org/wiki/Fructose_6-phosphate' } },
    { data: { id: 3, molecule: 'F1,6BP', image: 'assets/f16bp.svg', url: 'https://en.wikipedia.org/wiki/Fructose_1,6-bisphosphate' } },
    // GADP & DHAP is in equilibrium
    { data: { id: 4, molecule: 'GADP', image: 'assets/gadp.svg', url: 'https://en.wikipedia.org/wiki/Glyceraldehyde_3-phosphate' } },
    { data: { id: 5, molecule: 'DHAP', image: 'assets/dhap.svg', url: 'https://en.wikipedia.org/wiki/Dihydroxyacetone_phosphate' } },
    { data: { id: 6, molecule: '1,3BPG', image: 'assets/13bpg.svg', url: 'https://en.wikipedia.org/wiki/1,3-Bisphosphoglyceric_acid' } }
    // Remaining data excluded for brevity
  ],
  edges: [
    {
      data: {
        id: 'step1',
        enzyme: 'Hexokinase',
        source: 0, target: 1
      }
    }, {
      data: {
        id: 'step2',
        enzyme: 'Phosphoglucose isomerase',
        source: 1, target: 2
      }
    }, {
      data: {
        id: 'step3',
        enzyme: 'Phosphofructokinase',
        source: 2, target: 3
      }
    }, {
      data: {
        id: 'step4',
        enzyme: 'Fructose-bisphosphate aldolase',
        source: 3, target: 4
      }
    }, {
      data: {
        id: 'step5',
        enzyme: 'Triosephosphate isomerase',
        source: 4, target: 5
      }
    }, {
      data: {
        // DHAP is in equilibrium with GADP; only GADP moves pathway forward
        id: 'step5-reverse',
        enzyme: 'Triosephosphate isomerase',
        source: 5, target: 4
      }
    }, {
      data: {
        id: 'step6',
        enzyme: 'Glyceraldehyde 3-phosphate dehydrogenase',
        // 4 is GADP, 5 is DHAP and is therefore skipped over
        source: 4, target: 6
      }
    }
  ]
};
This will create a variable, GlyElements, which is accessible within glycolysis.js, saving us the effort of specifying each step as elements when initializing a Cytoscape.js graph.
One can see on the Wikipedia page for glycolysis that Step 4 produces a mixture of two products but only GADP moves forward in Step 6.
Because of this, edges are specified manually; connecting each node i to i+1 via a for-loop would not be accurate.
At this point, the workspace should be structured as follows, with glycolysis.js currently existing as an empty placeholder file.
glycolysis/
    +-- cytoscape.js (tested with v2.7.16)
    +-- gly_elements.js
    +-- glycolysis.js
    +-- index.html
Making the graph: glycolysis.js
Waiting for <div>: Ensuring cytoscape.js has a container to use
Last time, it was possible to place var cy = cytoscape({...}) after the <div> element to make sure that the graph had a container to use.
Because of putting <script src='glycolysis.js'></script> in <head>, ordering will not work this time.
Instead, using an event listener will make sure that no graph-related code is run before the DOM has finished being laid out.
Add document.addEventListener to the top of the file, as follows:
document.addEventListener("DOMContentLoaded", function() { ... });
All remaining code will go inside of the anonymous function (which will be executed once the DOM layout is finished).
A basic graph
Now that we are sure there is a <div> element to draw within, it’s time to call cytoscape().
  var cy = cytoscape({
    container: document.getElementById('cy'),
    elements: GlyElements,
    style: [
      {
        selector: 'node',
        style: {
          'label': 'data(molecule)',
          'width': '200px',
          'height': '200px'
        }
      }, {
        selector: 'edge',
        style: {
          label: 'data(enzyme)'
        }
      }
    ]
  });
Remember that this will all be indented within the function. As done previously, the graph will be created within the cy element.
The object passed to cytoscape() also contains some style directives for the graph.
In getting-started, the id property was used for labels; now, molecule will be used to provide more descriptive names.
Edges are given labels in the same manner as nodes: specify that a style is being applied to them via a selector then provide properties as a style object.
A label style is applied to both the nodes and edges so that viewers of the graph can tell what metabolite or enzyme is involved in each step.
For nodes, the width and height properties properties make each node 200px wide and 200px tall—large enough to hold the images.
You may notice that layout has not been specified yet.
It’s much more complex here than in Tutorial 1 and so will be covered in its own section.
Adding images
Return to the style property and add the following:
  var cy = cytoscape({
    container: document.getElementById('cy'),
    elements: GlyElements,
    style: [
      {
        selector: 'node',
        style: {
          'label': 'data(molecule)',
          'width': '200px',
          'height': '200px',
          'background-opacity': 0,
          'background-image': 'data(image)',
          'background-fit': 'contain',
          'background-clip': 'none'
        }
      }, {
        selector: 'edge',
        style: {
          'label': 'data(enzyme)'
        }
      }
    ]
  });
A background image may be added in a very similar manner to the label; 'data(image)' is enough to tell Cytoscape.js to use the image stored in the image data property.
'background-opacity'makes the back of the node transparent instead of the usual gray color.'background-image','background-fit', and'background-clip'all refer to the background images being used (the metabolite SVGs).'background-image': 'data(image)'uses the filename previously defined ingly_elements.js.'background-fit: 'contain'shrinks the images as needed to fit within the 200px nodes'background-clip': 'none'ensures that images that square images within round nodes are not cropped. Alternatively, node shaped could be changed tosquarewhen initializing the graph.
*Note: styling the elements requires adding SVG elements which for this tutorial are written as relative URLs.
To view images, you will likely need to point a webserver at the glycolysis directory (or whichever directory contains your work for this tutorial).
If using images stored locally, download the SVGs here. Unzip and make sure that your workspace is organized as follows:
glycolysis/
    +-- assets/
    |   +-- 13bpg.svg
    |   +-- 2pg.svg
    |   +-- 3pg.svg
    |   +-- dhap.svg
    |   +-- f16bp.svg
    |   +-- f6p.svg
    |   +-- g6p.svg
    |   +-- gadp.svg
    |   +-- glucose.svg
    |   +-- pep.svg
    |   +-- pyruvate.svg
    +-- cytoscape.js
    +-- gly_elements.js
    +-- glycolysis.js
    +-- index.html
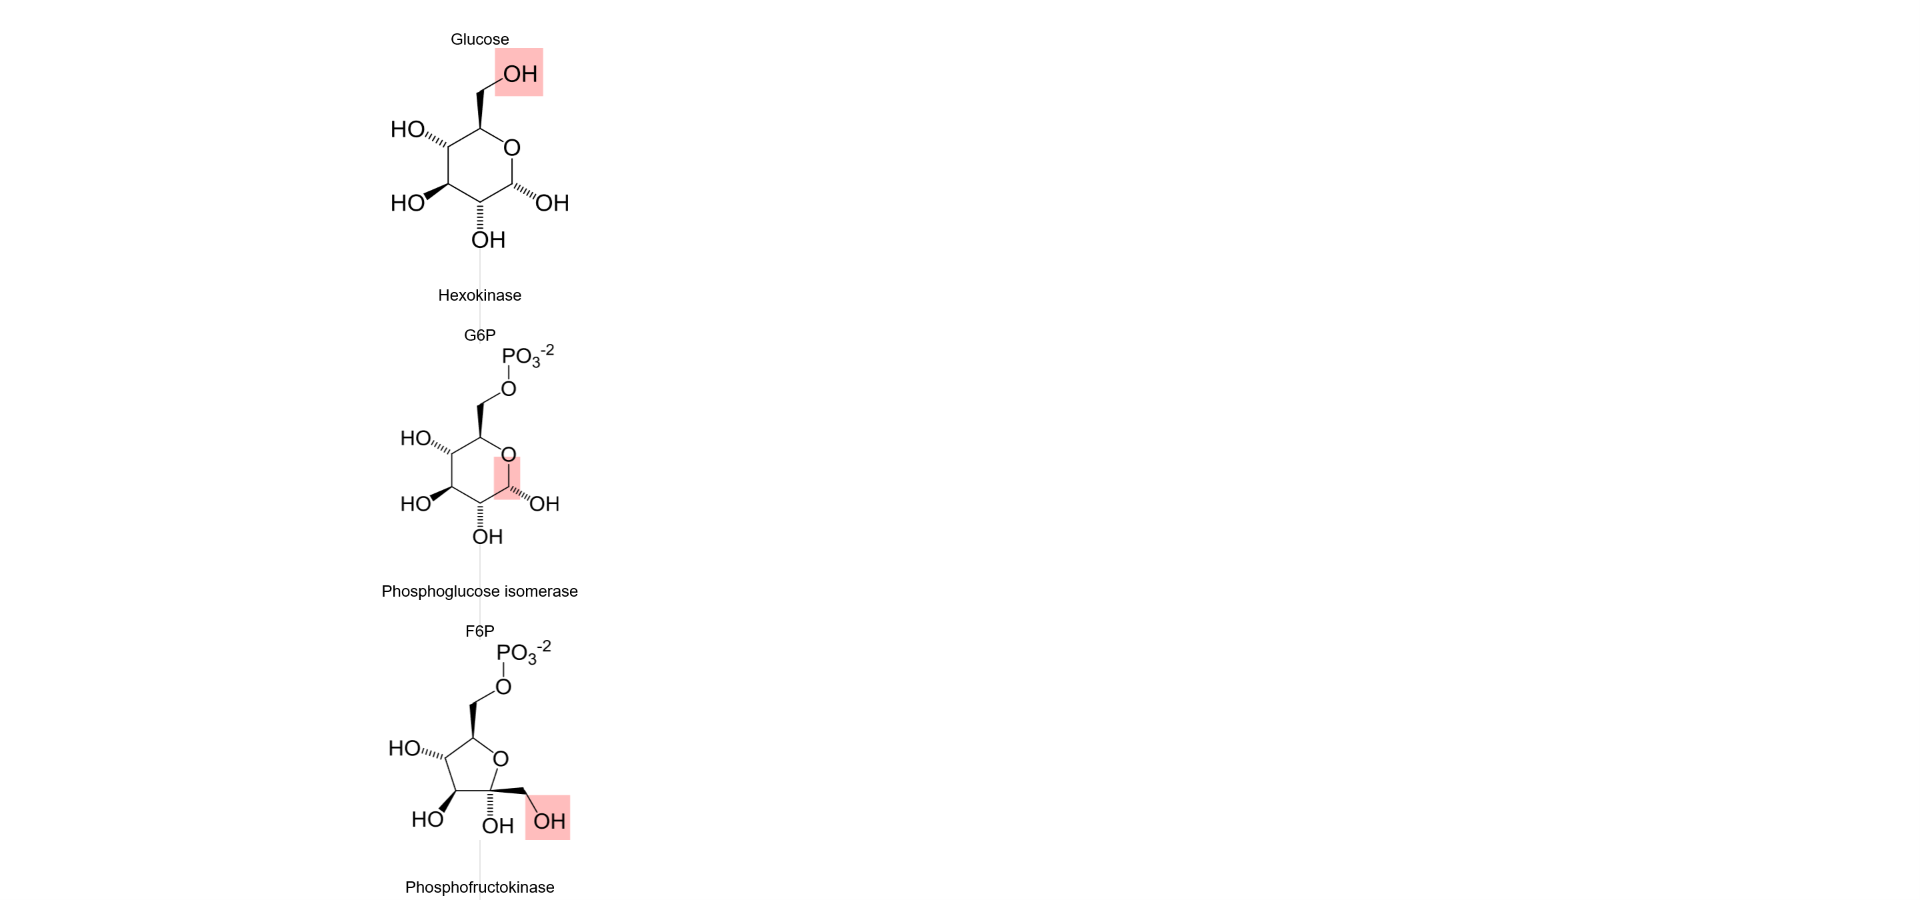
If you try viewing the graph now, it will look like (and this is putting it generously) a mess. Time to add a layout and fix this!
Laying out the graph
Now that all nodes are added and have images, it’s time to lay out the graph. Order is important here to make sure that all intermediate metabolites are laid out in the right order.
We’ll return to the graph initialization, so add a layout property right after style.
Since the graph will be laid out vertically, we’ll use a grid layout.
  var cy = cytoscape({
    // container, elements, and style have been omitted here for concision
    layout: {
      name: 'grid'
    }
  });
At this point, the graph will be spaced out but not yet arranged in the most sensible order. Some other options should be specified to get a better looking layout.
  var cy = cytoscape({
    // container, elements, and style have been omitted here for concision
    layout: {
      name: 'grid',
      fit: false,
      columns: 2,
      avoidOverlap: true,
      avoidOverlapPadding: 80
      }
  });
This will produce a better looking graph where all the intermediates are lined up vertically with enough padding between nodes to read enzyme names on the edges.
fit: falsestops Cytoscape.js from trying to fit the entire graph on one screen. With the molecule images, it’s best to keep them large and well-spaced and scroll down if necessary.columns: 1lines all elements up vertically. This will be useful later when scrolling the viewport.avoidOverlap: trueprevents images from overlapping and allows us to useavoidOverlapPaddingavoidOverlapPadding: 80puts 80 pixels between each node, giving enough space to read the enzyme names depicted on edges
There is still one problem though: DHAP is not put in the proper location. Since only one column is available to Cytoscape.js, it places DHAP underneath GADP which results in the edge from GADP going underneath DHAP to get to 1,3BPG. To fix this, we’ll create two columns in the graph but place everything except DHAP in the left-hand column. This way, DHAP will stick out to the right, making it easy to recognize that DHAP is in equilibrium with GADP and not a predecessor of 1,3BPG.
To create this layout, modify the object passed to layout slightly.
  var cy = cytoscape({
    // container, elements, and style have been omitted here for concision
    layout: {
      name: 'grid',
      fit: false,
      columns: 2,
      avoidOverlap: true,
      avoidOverlapPadding: 80,
      position: function(ele) {
        if (ele.data('molecule') === 'DHAP') {
          return { row: ele.id() - 1, col: 1 };
        }
        return { row: ele.id(), col: 0 };
      }
    }
  });
As noted previously, columns has been bumped up to 2.
Additionally, the position property is now specified.
The value of position is a function which returns a { row: x, col: y} type object, where x and y are grid coordinates for the object.
The most straightforward way to handle DHAP is to examine the name of the molecule currently being laid out.
This is retrieved by looking up the value of molecule in the node’s data object, with ele.data('molecule').
If the node’s molecule name is ‘DHAP’, it’s put in the second column; otherwise, the first column.
All nodes are put in rows matching their ID—another advantage to using incrementing integers for IDs.
The row of DHAP is decremented by 1 so that it appears directly to the right of GADP rather than diagonal to it.
Finally, let’s lock the elements to make sure that users don’t mess up our careful layout!
Add the following after graph initialization and before the forEach() background image call.
cy.autolock(true);
This will lock the graph in the current layout, preventing users from dragging nodes around (but not from scrolling the viewpoint).
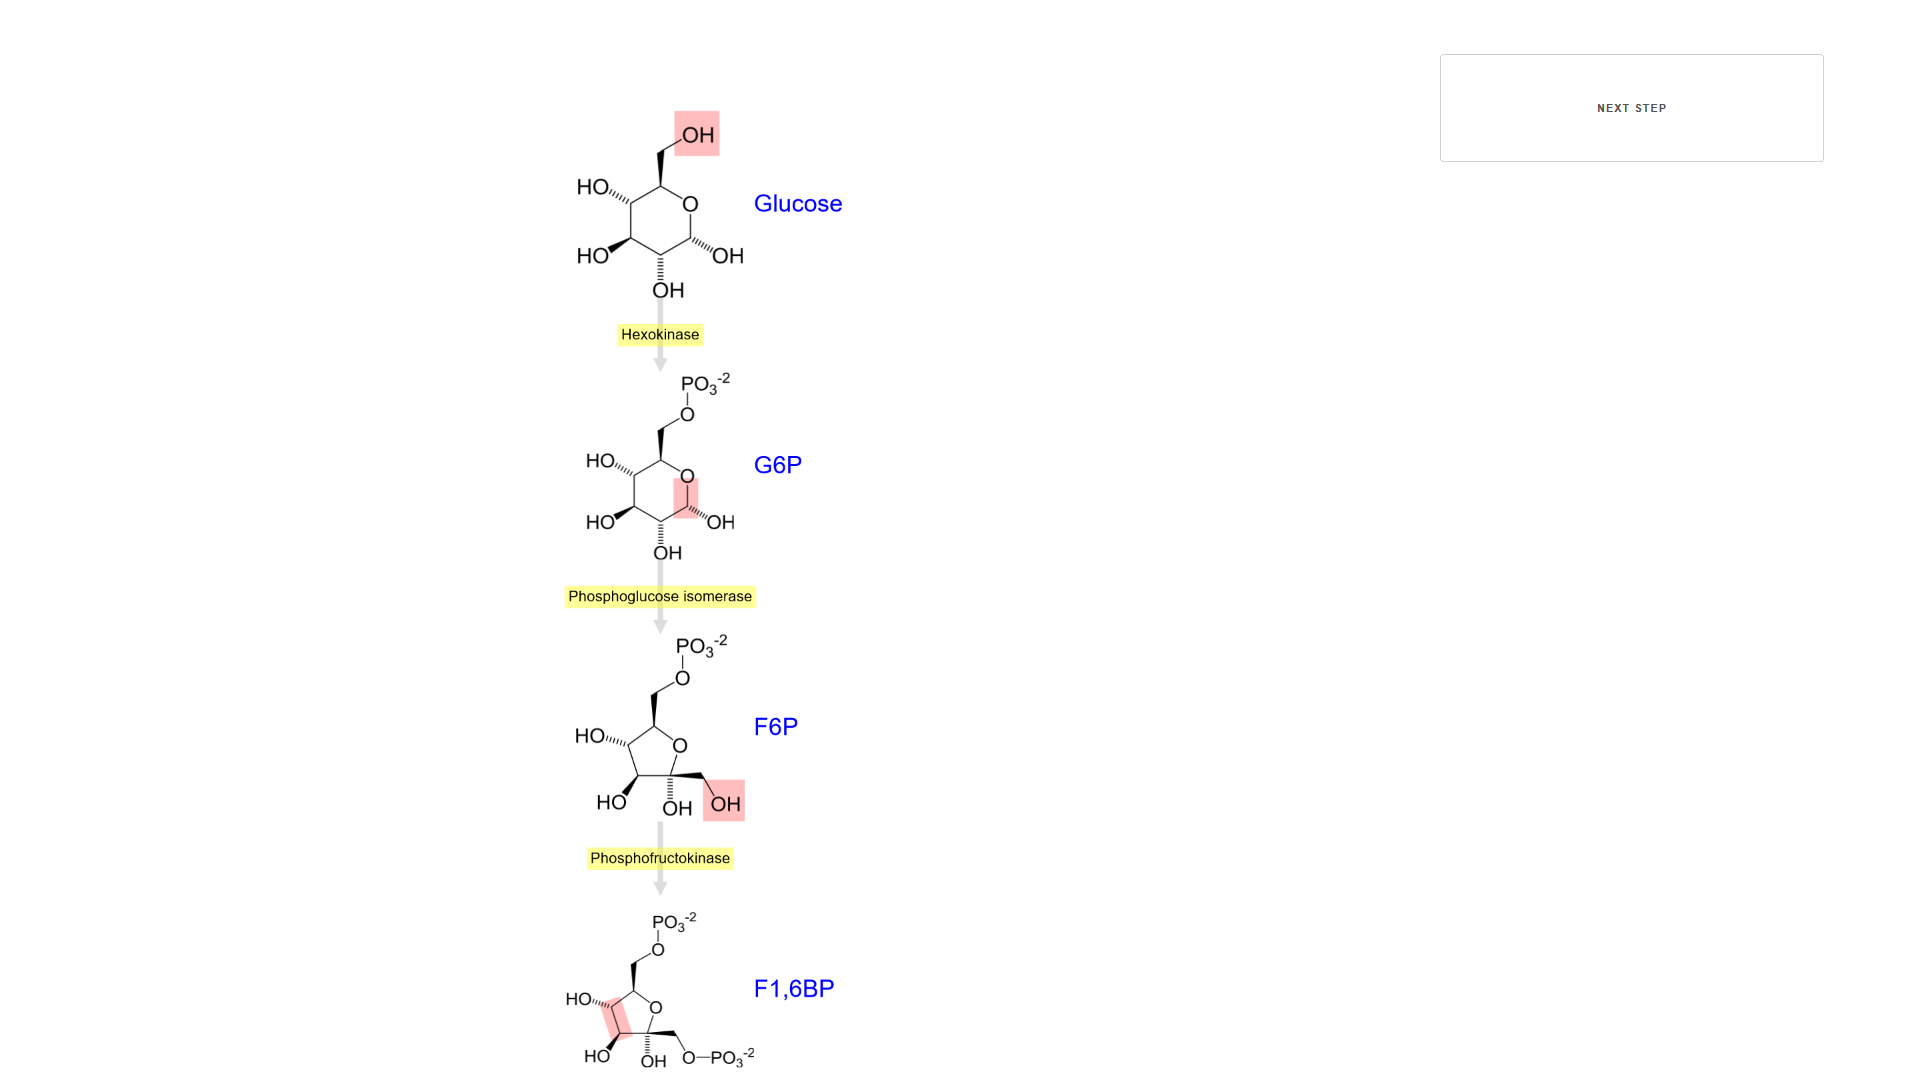
Congratulations, you’ve made a glycolysis graph! It should look similar to this:
Animation
Now that the graph has been created and filled, it’s time to add some animation. After the graph is loaded, the viewport will zoom in to the first element (glucose). Then, each time a “Next Step” button is clicked, the graph will scroll to focus on the next element.
The process of animating the graph is broken down into several steps:
- Focusing on the first element of the graph after loading
- Creating an advanceByButton function to focus on the next element
- Another function will be used for finding the next element
- The function created in Step 1 (for focusing on an element) can be reused for focusing on the next element
- Adding a button to the graph which will execute the advanceByButton function
Focusing on the first element
First of all, a function must be written that can focus on an element passed to it.
We’ll call it panIn(target), where target is a Cytoscape.js element.
function panIn(target) {...} should be placed right after the forEach() call which applies background images, within the Event Listener function.
  function panIn(target) {
    cy.animate({
      fit: {
        eles: target,
        padding: 200
      },
      duration: 700,
      easing: 'ease',
      queue: true
    });
  }
cy.animate({...}) is a Cytoscape.js function which animates a change in the viewport.
Its net effect is a combination of cy.animation({...}) and ani.play() which will create an animation on a viewport and run that animation, respectively.
cy.animate() is a viewport animation, meaning that it changes the view of the graph without moving any elements around.
I’ve specified the options necessary for this tutorial but more options are documented with cy.animate().
fit:eles: targetwill focus the viewport aroundtarget.targetis initially the first element (glucose) but will change as the user advances the view with the “Next Step” button.padding: 200adds white space aroundtargetto help things look less crowded. Large padding means users can see nearby nodes.
duration: 700tells Cytoscape.js to draw the animation out for 700ms (so that enzyme text may be read)easing: 'ease'gives the graph a nice transition between stationary and animated (linearis the default ifeasingis unspecified)queue: truewill queue up animations so that successive clicks of “Next Step” will advance the graph several steps.
Now that a function which can animate viewport changes has been created, it’s time to put it to use. To start, we’ll focus on the first element of the graph after loading (instead of displaying several elements).
var startNode = cy.$('node[molecule = "Glucose"]');
This function should be placed after panIn(target), i.e. the last statement in the function given to the Event Listener.
cy.$(selector) is a quick way to get all elements from the graph that match a selector (it is simply an alias to cy.filter()).
As with previous selectors, the selector is a specially formatted string.
The first part, node, will select all nodes in the graph (this could also be done with cy.nodes(), which also acceptors a selector to filter nodes).
The second part, [molecule = "Glucose"], selects only the glucose node so that the graph is focused on a single node.
Square brakets are used in selectors to perform matching against data attributes.
In this case, we are matching against the molecule attribute that was defined in gly_elements.js and is being used as node labels.
Because the matching is against a string, "Glucose" must be enclosed in double quotes.
Once the initial node has been found, zooming in on it is easy.
panIn(startNode);
This will call panIn(target) with startNode (glucose) as the target.
If you reload index.html, the graph should now focus on only the first element (glucose) instead of all elements.
Writing advanceByButton(previous)
To start out, it’s important to select the first node (glucose).
Selection status will be used later when determining whch node will be panned to during animation.
Modify the previous code to insert a call to select():
  var startNode = cy.$('node[molecule = "Glucose"]');
  startNode.select();
  panIn(startNode);
eles.select() will mark whichever node(s) it is called on as selected.
In this case, only a single node (the glucose node) is selected.
Now that the starting node is selected, it’s time to write the advanceByButton() function.
advanceByButton() takes one argument, previous, the previously selected node.
Determining the selected node will be done by a function which is called when the “Next Step” button is clicked.
Add advanceByButton(previous) immediately after panIn(target).
  function advanceByButton(previous) {
    previous.unselect();
    var nextSelect = findSuccessor(previous);
    nextSelect.select();
    panIn(nextSelect);
  }
findSuccessor(previous) will be covered soon.
previous.unselect() will unselect the selected node so that only one element (the successor) is selected at a time.
Note that by default Cytoscape.js will unselect elements when new elements are selected so this not strictly necessary.
var nextSelect = findSuccessor(oldSelect) finds the next element from oldSelect.
Because some special treatment is required for DHAP (to avoid getting stuck in a loop), I chose to break findSuccessor out into its own function.
Finally, the next element is selected and the animation is run, reusing the panIn(target) function previously defined.
Writing findSuccessor(selected)
As usual, the edge case of DHAP makes things more complicated.
The successor is whichever node has the highest ID relative to the current node, excluding the current node.
There is no guarantee that selected will be a node.
If a user has selected an edge, then the behavior for finding connected nodes will change.
  function findSuccessor(selected) {
    var connectedNodes;
    if (selected.isEdge()) {
      connectedNodes = selected.target();
    } else {
      connectedNodes = selected.outgoers().nodes();
    }
    var successor = connectedNodes.max(function(ele) {
      return Number(ele.id());
    });
    return successor.ele;
  }
First, var connectedNodes is declared. connectedNodes is then modified in the if/else block.
The if/else block handles cases where the user has manually selected an edge instead of the nodes that are normally selected.
If an edge is selected, selected.target() returns its target, paying attention to edge direction.
If edge direction is unimportant, selected.connectedNodes() may be used, which will return both the source and target.
When a node is selected, selected.outgoers().nodes() is used, which combines outgoers() with nodes() to find nodes connected to the selected node.
Usually connectedNodes is just one target, except for GADP which has two targets (DHAP and 1,3BPG).
In the case of two targets, the successor is defined to be the one with the highest ID.
    var successor = connectedNodes.max(function(ele) {
      return Number(ele.id());
    });
connectedNodes.max(function) takes a function as an argument and will return an object ({ value, ele }) that corresponds to the largest element.
Any property of an element can be compared by max() via the function provided to max() which will return a specified property of ele for comparison.
Like forEach(), max() will provide several parameters (ele, i, and eles) to the provided function but we will only be using ele.
The call to ele.id() is wrapped with Number() here to ensure that integer comparison is done rather than string comparison.
Once max() has finished, the ele property of successor is returned and will be the next node the animation focuses on with panIn(nextSelect).
Adding a “Next Step” button
Now that all the animation mechanics are taken care of, it’s important to add a way to use these animations!
Adding an animation button will be done by modifying the DOM within glycolysis.js.
But first, let’s give the button a style: medium sized, in the top right.
Reopen index.html and add the following CSS style within the <style> tag, right after #cy.
    #advance {
        width: 20%;
        height: 10%;
        position: absolute;
        top: 5%;
        right: 5%;
    }
Then make a button element in <body>, after the cy element.
<body>
    <div id='cy'></div>
    <input type='button' id='advance' value='Next Step'>
</body>
Now return to glycolysis.js.
To add a function to this button, we need to select it and give it a function to run when clicked.
This can be done with document.getElementById('advance') and addEventListener().
  var advanceButton = document.getElementById('advance');
  advanceButton.addEventListener('click', function() {
    var previous = cy.$(':selected');
    advanceByButton(previous);
  });
Again, this function goes inside the function being passed to addEventListener().
After getting the 'advance' element, a function is declared to handle a click event.
Cytoscape.js has a special query, ':selected', which we will use to our advantage to advance the viewport.
This affords more flexibility than storing the node in a currentView variable, which would not allow users to click on different parts of the graph and animate from there.
The previously selected element is stored in previous and passed to advanceByButton(previous), which uses the previously selected element to find the next element in the graph.
Improving the graph
Looping back to the beginning
Currently, the graph will reach pyruvate and the “Next Step” button will lose its effect (since pyruvate is the final metabolite and has no successor).
One possibility is adding an edge back from pyruvate to glucose but this reduces accuracy of the graph—glucose cannot be produced from pyruvate.
Instead, we’ll modify advanceByButton() to recognize when it is at the last element and loop back to the beginning.
There are two possibilities here for recognizing when we are at the end of the graph:
nextSelectis undefined because there is no successor to the final elementpreviousrefers to pyruvate, which is the final element.
I’ll be using option 2 but option 1 is equally easy to implement.
  function advanceByButton(previous) {
    previous.unselect();
    var nextSelect = findSuccessor(previous);
    if (previous.id() === cy.nodes('#10').id()) {
      // loop back to beginning instead of repeating pyruvate
      nextSelect = cy.nodes('#0');
    }
    nextSelect.select();
    panIn(nextSelect);
  }
The ID of previous is compared with the ID of pyruvate and if equal, nextSelect is changed to the first element of the graph, glucose.
These steps are easily accomplished with cy.nodes('#0'), another selector which matches against element IDs.
A better style
The current appearance of the graph leaves something to be desired; edges should be more visible and labels would look better if they stood out more. Plenty of style options are available so we’ll make use of them in the graph declaration. You can play around with various properties but I’ve settled on these for producing a reasonably good-looking graph:
  var cy = cytoscape({
    container: document.getElementById('cy'),
    elements: GlyElements,
    style: [
      {
        selector: 'node',
        style: {
          'label': 'data(molecule)',
          'width': '200px',
          'height': '200px',
          'color': 'blue',
          'font-size': '26px',
          'text-halign': 'right',
          'text-valign': 'center',
          'background-opacity': 0,
          'background-image': 'data(image)',
          'background-fit': 'contain',
          'background-clip': 'none'
        }
      }, {
        selector: 'edge',
        style: {
          'curve-style': 'bezier',
          'label': 'data(enzyme)',
          'text-background-color': 'yellow',
          'text-background-opacity': 0.4,
          'width': '6px',
          'target-arrow-shape': 'triangle',
          'control-point-step-size': '140px'
        }
      }
    ],
    layout: {} // omitted for concision
  });
More animation options
Right now, users can only animate the graph by clicking the “Next Step” button. They are able to select nodes by clicking and then running the animation from there, but it’s possible to save them a step. We’ll add an event listener that will pan whenever a node is clicked, saving the user from having to use the “Next Step” button.
cy.on() permits handling any event that occurs in graph area.
In this case, we’re only interested in tap events on nodes so we’ll use a selector to narrow this down: cy.on('tap', 'node', function).
Now all that’s left is to write the function:
  cy.on('tap', 'node', function(event) {
    var target = event.target;
    cy.nodes().unselect();
    target.select();
    panIn(target);
    window.open(target.data('url'));
  });
By passing event to the function, the target of the event can be read with event.target.
This function includes much of the functionality of advanceByButton(previous); however, advanceByButton(previous) expects to be passed the previously selected node while this function does not care about the previously selected node.
Instead, animation will skip forward or back to center on the tapped node.
This node is selected and all other are unselected.
Then, panIn(target) is called, just as it is in advanceByButton(previous).
Finally, we’ll open a link to the Wikipedia page about the selected molecule.
This is easily done by opening a new window/ tab (window.open()) and passing the url, stored in each node’s data.
Adding a CSS framework
The final step is to make sure everything looks nice. A simple framework, such as Skeleton is a nice fit here. Download the .zip file, copy the two CSS files to the root of the folder, and the graph will now have a uniform style!
<head>
    <meta charset='utf-8'></meta>
    <title>Tutorial 2: Glycolysis</title>
    <link href='normalize.css' rel='stylesheet' type='text/css' />
    <link href='skeleton.css' rel='stylesheet' type='text/css' />
    <script src='cytoscape.js'></script>
    <script src='gly_elements.js'></script>
    <script src='glycolysis.js'></script>
</head>
Conclusion
Now you should have a fully working glycolysis graph, looking similar to this:
Thanks to:
- Metabolite SVGs: modified from Thomas Shafee (Own work) [CC BY-SA 4.0], via Wikimedia Commons
- Pathway: Glycolysis on Wikipedia by Wikipedia contributors, licensed under CC-BY-SA